Sainsbury’s and Morrisons outperformed in the latest Kantar Worldpanel figures, while Tesco and Asda were slightly behind the market.
Want to know more?
Visit Retail Week Knowledge Bank for detailed data and analysis
In the 12 weeks ending February 20, Sainsbury’s grew at 5.2% and Morrisons at 4.5%. Sainsbury’s market share moved up to 16.5%, compared to 16.3% a year ago, while Morrisons maintained its 12.3% share.
Tesco’s share stands at 30.3% while Asda’s is 16.9%.
The overall market growth slowed slightly to 3.9% compared to 4.2% last month.
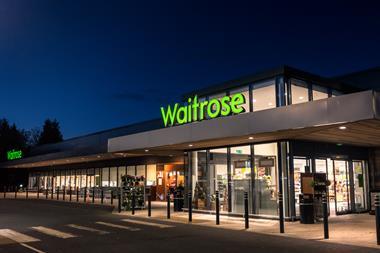
Fraser McKevitt, retail analyst at Kantar Worldpanel said: “Waitrose followed the market trend of slightly slower growth this period, but still posted increased sales of 6.6% compared to a year ago, taking its market share to 4.4%, the highest ever recorded by the retailer.”
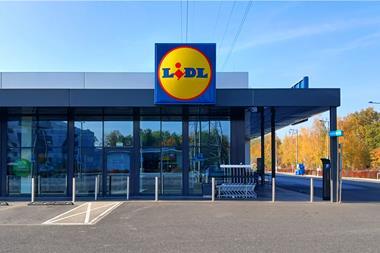
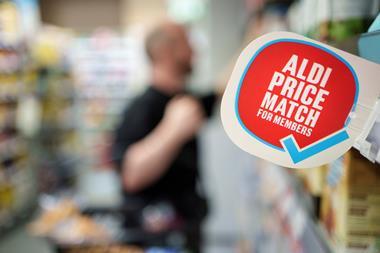
2011 has seen a return to strong growth from the discounters, both Aldi and Lidl delivering double digit growth, well-ahead of their performances in 2010. Aldi now holds 3.1% of the market, up from 2.8% last year and Lidl holds 2.4%, up from 2.2%.
McKevitt said: “With economic uncertainty increasingly in the news it is no surprise that shoppers are being cautious with their spending. However, while the discounters are performing well this is not due to an increase in new shoppers, but rather because their existing customers are spending more with them. The majority of people continued to seek value through promotions in the mainstream retailers, rather than trading down to the discounters.”
The Co-operative’s market share stabilised at 6.7% but this is still a drop from 7.4% a year ago. Iceland’s share remained at 2%.
Grocery inflation stands at 3.7%, up from 3.1% last month, but well below levels seen in 2008 and 2009.
| MARKET SHARE - TOTAL TILL ROLL | |||||
| 12 Weeks to 21 February 2010 | 12 Weeks to 20 February 2011 | change | |||
| £000s | % * | £000s | % * | % | |
| Total Till Roll | 32,697,430 | 33,481,690 | 2.4 | ||
| Total Grocers | 23,375,010 | 100.0% | 24,293,570 | 100.0% | 3.9 |
| Total Multiples | 22,847,840 | 97.7% | 23,758,940 | 97.8% | 4.0 |
| Tesco | 7,102,289 | 30.4% | 7,352,270 | 30.3% | 3.5 |
| Asda | 3,973,558 | 17.0% | 4,095,348 | 16.9% | 3.1 |
| Sainsbury’s | 3,799,905 | 16.3% | 3,998,365 | 16.5% | 5.2 |
| Morrisons | 2,865,051 | 12.3% | 2,992,551 | 12.3% | 4.5 |
| Co-operative | 1,323,593 | 5.7% | 1,619,068 | 6.7% | 22.3 |
| Somerfield | 396,223 | 1.7% | 18,569 | 0.1% | -95.3 |
| Waitrose | 995,419 | 4.3% | 1,061,048 | 4.4% | 6.6 |
| Iceland | 458,996 | 2.0% | 474,598 | 2.0% | 3.4 |
| Aldi | 657,247 | 2.8% | 745,049 | 3.1% | 13.4 |
| Lidl | 520,401 | 2.2% | 591,199 | 2.4% | 13.6 |
| Netto | 161,342 | 0.7% | 158,756 | 0.7% | -1.6 |
| Farm Foods | 119,223 | 0.5% | 131,768 | 0.5% | 10.5 |
| Other Multiples | 474,589 | 2.0% | 520,356 | 2.1% | 9.6 |
| Symbols & Independents | 527,176 | 2.3% | 534,622 | 2.2% | 1.4 |
* = Percentage Share of Total Grocers


No comments yet